
Where Should We Build?
This week, I’d like to show you how using data can help us make smart, informed decisions when it comes to urban planning and the future of our city.
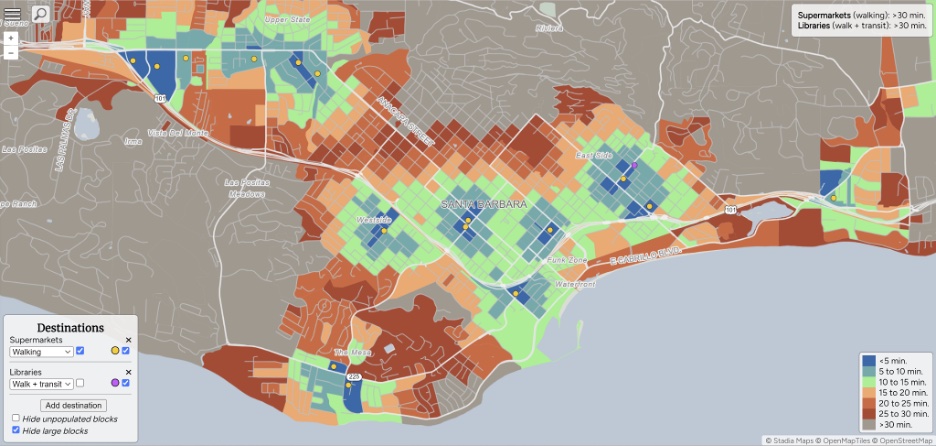
Using the new tool close.city, we can visualize where the most walkable and bikeable areas in the city already are. Depending on which layers are selected, blocks in blue and green are already within a five to 15-minute walk or bike ride of supermarkets, meaning density should be prioritized in those areas. New residents who live in blue or green blocks are most likely to walk or cycle for errands. Let’s start with walkability only:
If we look at this first map, which has the walking layer activated, and only supermarkets as a destination, we can see that most of the city by area is gray – or completely unwalkable. However, much of downtown, and areas of Upper State and The Mesa have highly walkable areas.
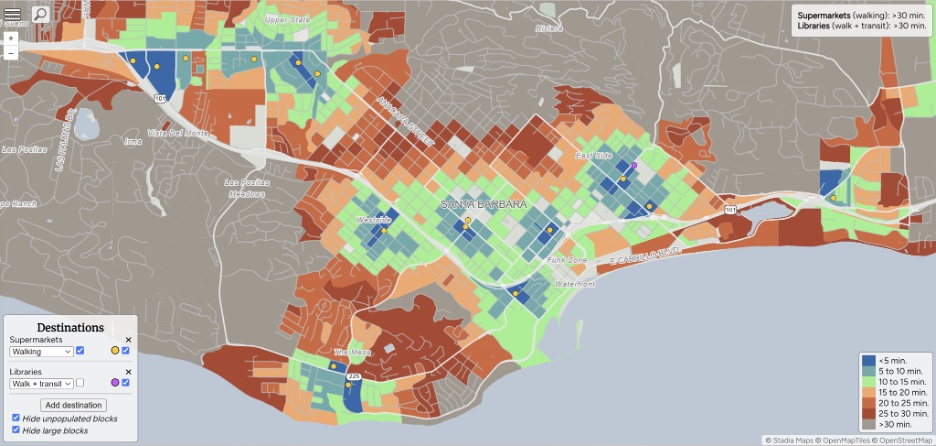
If we turn on the “hide unpopulated blocks” tool, we can see how many blocks have zero people living on them:
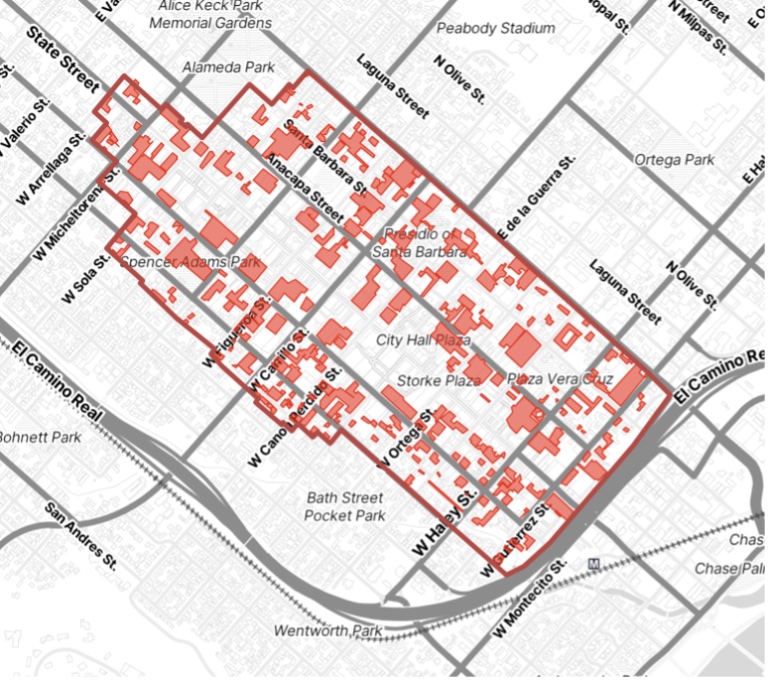
We can immediately notice that many of the city’s blocks with the most walking potential are uninhabited. Looking closer at the downtown area – unfortunately, 11 of the city’s blocks in its most walkable areas are totally uninhabited. These are the places that housing should be prioritized.
Some good news: La Cumbre Plaza is amongst the most walkable places in the entire city, and it’s slated for a redevelopment project that could bring hundreds of units to the site. These people will be more likely to not drive for their daily needs than if the housing was built nearly anywhere else.
A similar analysis for bikeability looks similar to the walkability maps, but much more of the city becomes blue and green because bikes have a longer range than walking in the same amount of time.
When examining the maps, it’s important to note that this mapping tool does not take topography into account. This means that although it looks easy on the map to bike from the Alta Mesa to Lazy Acres and back, the return trip uphill might take longer than the color of the map suggests. However, e-bikes are a great new tool that dramatically lowers the amount of effort needed for these types of trips. Finally, the map does not show where there is bike infrastructure. Though certain areas, like Upper State and Downtown, may be connected by a blue area, safe and reliable bike infrastructure may be lacking in the connection. This is important, as it has been shown that there is a strong correlation between the presence and quality of bike facilities and the number of people who bike.
Lastly, we activate both grocery stores and libraries for walking and biking. Looking at the map (again, available on the online version of this piece), we can see that if someone wanted to live within walking distance of both a grocery store and a library, the Eastside is the only neighborhood that offers this choice. In the entire city, there is just the one single half-block that is a five-minute walk from both amenities.
Activating unpopulated blocks, we can see a surprising number of blocks in the city’s most walkable area are uninhabited. This map also helps us visualize how adding a freeway crossing could connect more blocks to this area.
Why is this Important?
This analysis offers multiple insights. Santa Barbara as a city and region is striving to be more “green” and lower its carbon emissions. While each of us on an individual level can make choices that are better for the environment, there’s no question that it takes municipal-level changes to really make an impact on emissions. The largest emissions sector – locally and nationally – is transportation; comprising up to 40-50% of all carbon emissions. Of that, 80% is from private vehicle use.
While we build safer bike infrastructure to attract more users, and install EV chargers to make driving them easier, we also need to prioritize creating urban environments that have sustainability built into them. The best way to do this is to create neighborhoods where walking and biking don’t have to be encouraged but are simply the easiest default option to meet daily needs. We know this is possible – some cities in the Netherlands have 80% bike and walking mode share, thanks to a combination of safe infrastructure and locating amenities and housing in proximity.
Thanks to our traditional street grid laid out by Salisbury Haley in 1851, Santa Barbara has a street network conducive to walking and biking. Many older neighborhoods already feature corner stores, putting residents a short distance from grabbing a quick snack or household necessities. However, we can do more. We can start by legalizing existing corner stores in our zoning code and allowing new ones in more neighborhoods. As the maps (page 16) display, we should also prioritize building dense housing with little parking in areas that are already walkable. We already do this in part – our zoning code allows for the densest uses downtown, with 63 units/acre.
However, this zoning doesn’t seem to be enough. Strong Towns Santa Barbara partnered with a national nonprofit called Parking Reform Network, and found that 27% of our downtown – the land zoned for the most density and best suited for walkability – is taken up by parking lots!
Clearly, we’re not doing enough. The situation surely isn’t helped by advisory boards like the Architectural Board of Review, which in a recent meeting attempted to severely downsize a proposed five-story apartment building, with board member Richard Six saying, “There needs to be a lot of rethinking and a radical reduction of the project.” The board’s comments ignore the fact that the building, as proposed, is allowed under our zoning code. Also, the board was formed to comment on and regulate architectural elements – not number of units or height.
Before I get ahead of myself, I’ll say that the purpose of this article is not to propose solutions, but simply to help the public and elected and appointed officials think about our city and its potential future in a new way. When we make decisions about State Street, for instance, we may want to consider the information on these maps; though the entirety of the State Street promenade is not within a 10-minute walk of a grocery store, it is within a five-minute bike ride of one. This reinforces the fact that bikes should be included in the State Street master plan, from both an economic and mobility perspective. Going forward, analysis like these can help our city make more informed decisions.
You might also be interested in...


You must be logged in to post a comment.